|
| 1027 | FCIC Task 6 - High Temperature Conversion | The objectives of Task 6 are to (1) Develop a science-based understanding of how variable feedstock CMAs impact intermediate product quality attributes (critical quality attributes or CQAs) from high temperature conversion processes; and (2) Use this understanding to develop and deploy a validated, multiscale experimental and computational framework that allows biorefineries to optimize productivity and control CQAs with variable incoming CMAs. The focus is on de-risking feedstock variability for thermal conversion pathways to produce sustainable aviation and marine fuels, and (with Task 8) providing guidance on which technologies may be the most advantageous, from a technical, economic, and sustainability standpoint.
Click on the ‘File Count’ entry on the right to view and download Task 6 data sets and summary information about Task 6.
2-inch Fluidized Bed Reactor (2FBR) Pyrolysis Oil Production
A brief description of 2FBR operation:
Below is a description of the 2FBR operation outlined in the 2017 paper. Details can vary depending on the specific circumstances or conditions.
Biomass (< 2.0 mm) was pyrolyzed in a bed of silica sand (300-500 μm), which was fluidized with 14 standard L/min of nitrogen. The bed was indirectly heated with a furnace to 500 °C and the temperature was measured at three points vertically, which were typically within 10 °C of the desired temperature. Biomass was fed with an auger at a typical rate of 400 g/h into the bed, 2 cm above the gas distributor plate. Roughly 2 kg of material was fed for each experiment with the goal of producing ~1 L of oil for subsequent hydroprocessing tests. Char exiting the bed was removed in the solids cyclone and remaining fine particles were removed downstream with a hot filter (2 µm 316SS pleated stainless steel screen). All lines, cyclone, and filter were heat traced and kept at >400 °C before a three-stage condensation train.
Liquid products were condensed using an air-cooled condenser cooled by simple convection and allowed to flow into an ice-cooled, two‑neck flask. The gas/aerosol phase passing out of the flask entered a 5 cm (2”) diameter electrostatic precipitator (ESP). The ESP was operated with a 5 kV potential on the central conductor and was also maintained at ambient temperature by air cooling. Liquids collected in the ESP were drained as needed into a 1 L sample bottle. The effluent passed into a cold finger dry ice trap and coalescing filter. All parts of the condensation train were weighed to obtain a raw oil yield and the collected liquids were brought to room temperature and combined in the 1 L bottle. The contents were then homogenized with a high shear mixer (LSK-1 with 2” slotted head, Charles Ross & Son Company®).
Permanent gases leaving the dry ice trap were sent to a dry test meter to measure total gas volume before venting. A slipstream of the vent gas was fed to a bank of analytical instruments to monitor gas composition in real time: a California Analytical Instruments Model300® NDIR for CH4, CO, and CO2; a thermal conductivity monitor TCM4 for H2; and a three-channel Varian CP 4900 MicroGC for permanent gasses and C2/C3 hydrocarbons (MS‑5A x 10m, PBQ x 10m, CP‑Sil 5 x 8m).
2FBR Diagram
Two-Stage Hydrotreating Process
Below is a description of the two-stage hydrotreating operation outlined in the 2017 paper. Details can vary depending on the specific circumstances or conditions.
A process flow diagram is shown in Figure S-2.
The hydrotreater had an inner diameter of 1.3 cm and an overall length of 63.5 cm. The first stage utilized a ruthenium catalyst on a carbon support. This catalyst was 7.8 wt% Ru prepared by impregnating ruthenium nitrosyl nitrate purchased from BASF on washed Norit ROX 0.8 CE purchased from Sigma-Aldrich using an incipient wetness procedure. At the reactor inlet, 2 g of the Ru/C extrudates were loaded as a “guard bed” to prevent plugging. This is necessary due to the non-isothermal zone at the reactor inlet, which can result in bio-oil polymerization. By adding the extrudates there is enough catalyst activity to prevent polymerization, but the lower active site density combined with the overall LHSV results in a negligible conversion contribution from the guard bed. From 5 cm to 32 cm within the reactor, 10 g of +30 to 60 mesh Ru/C was loaded. This reactor zone was kept at 220 °C and 10.3 MPa (1500 psi).
The second zone, located at 32 cm to 64 cm, utilized a cobalt/molybdenum catalyst on an alumina support (cobalt oxide 3.4– 4.5%, molybdenum oxide 11.5 – 14.5%, on alumina, purchased from Alfa Aesar). Approximately 15 g of the catalyst was loaded in this zone, which was operated at 400 °C and 10.3 MPa (1500 psi). Prior to every experiment, the catalysts were sulfided by feeding Di-tert-butyl-disulfide to the reactor for approximately 12 hours via the ISCO syringe pumps seen in Figure S-2. The fast pyrolysis oil was fed to the reactor using a syringe pump. The total liquid flow rate for all experiments was 48 mL/hr. H2, in stoichiometric excess, and He were fed to the top of the reactor along with the bio-oil. The liquid products were collected in a pressurized sample reservoir that was drained every six hours, and the oil and aqueous phases were subsequently gravity separated.
The gases exiting the reactor passed through a Dry-Cal flow meter and were analyzed using an Agilent 3000A Micro-GC. The Dry-Cal flow meter and the gas chromatograph were operated continuously.
Two-Stage Hydrotreating Diagram
2FBR Data Correction
Dataset
|
Action
|
Justification
|
| FY23 Pyrolysis Yield |
Delete observation with TRB Run Number: 7966-012 |
An integration error was found in the moisture measurement of the Residues (A) and Residues (A) AC 10Hz, which, when corrected, lowered the amount of moisture, and thus the liquid yield. In the case of Residues (A) the drop in moisture was large enough to drop the total mass balance below expected (90-110%, with 2 significant figures). As this system reliably produces mass balances in this expected range, we conclude there was another error in that experiment, which we cannot track down three years after it was performed. Thus, we have decided to remove the Residues (A) experiment. |
I. ABSTRACT
Feedstock composition can affect final fuel yields and quality for the fast pyrolysis and hydrotreatment upgrading pathway. However, previous studies have focused on individual unit operations rather than the integrated system. In this study, a suite of six pure lignocellulosic feedstocks (clean (no bark) pine, whole-tree (including bark) pine, tulip poplar, hybrid poplar, switchgrass, and corn stover) and two blends (equal weight percentages whole-tree pine/tulip poplar/switchgrass and whole- tree pine/clean pine/hybrid poplar) were prepared and characterized. These materials then underwent fast pyrolysis and hydrotreatment. Although some feedstocks showed a high fast pyrolysis bio-oil yield, such as tulip poplar at 60%, high yields in the hydrotreater were not always observed. Results showed overall fuel yields of 17% (switchgrass), 20% (corn stover), 24% (tulip poplar, blend 1, blend 2), 25% (whole-tree pine, hybrid poplar), and 27% (clean pine). Simulated distillation of the upgraded oils indicated that the gasoline fraction varied from 39% (clean pine) to 51% (corn stover), while the diesel fraction ranged from 40% (corn stover) to 46% (tulip poplar). Little variation was seen in the jet fuel fraction at 11−12%. Hydrogen consumption during hydrotreating, a major factor in the economic feasibility of the integrated process, ranged from 0.051 g/g dry feed (tulip poplar) to 0.070 g/g dry feed (clean pine).
FULL PUBLICATION ATTACHED
acs.energyfuels.5b00304.pdf
II. Method Visualization
III. Data
Data available in attached files.
I. ABSTRACT
We report here on an experimental study to produce refinery-ready fuel blendstocks via catalytic hydrodeoxygenation (upgrading) of pyrolysis oil using several biomass feedstocks and various blends. Blends were tested along with the pure materials to determine the effect of blending on product yields and qualities. Within experimental error, oil yields from fast pyrolysis and upgrading are shown to be linear functions of the blend components. Switchgrass exhibited lower fast pyrolysis and upgrading yields than the woody samples, which included clean pine, oriented strand board (OSB), and a mix of pin~on and juniper (PJ). The notable exception was PJ, for which the poor upgrading yield of 18% was likely associated with the very high viscosity of the PJ fast pyrolysis oil (947 cp). The highest fast pyrolysis yield (54% dry basis) was obtained from clean pine, while the highest upgrading yield (50%) was obtained from a blend of 80% clean pine and 20% OSB (CP8OSB2). For switchgrass, reducing the fast pyrolysis temper- ature to 450 C resulted in a significant increase to the pyrolysis oil yield and reduced hydrogen con- sumption during hydrotreating, but did not directly affect the hydrotreating oil yield. The water content of fast pyrolysis oils was also observed to increase linearly with the summed content of potassium and sodium, ranging from 21% for clean pine to 37% for switchgrass. Multiple linear regression models demonstrate that fast pyrolysis is strongly dependent upon the contents of lignin and volatile matter as well as the sum of potassium and sodium.
FULL PUBLICATION ATTACHED
Supplementary Attached
FeedstockBiomassandBioenergy2017.pdf
FY17_Supplementary_Docs.docx
Hybrid Poplar Overview
A control hybrid poplar and three genetically modified hybrid poplars were characterized for their lignin content and S/G ratio of their lignin and then pyrolyzed to determine the effect of lignin quantity and type on the fast pyrolysis conversion yields and oil properties.
The hybrid poplar samples converted at NREL were developed and donated by the Center for Direct Catalytic Conversion of Biomass to Biofuels (C3Bio), an Energy Frontier Research Center funded by the U.S. Department of Energy Office of Science, Office of Basic Energy Sciences under Award Number DE-SC0000997.
Hybrid Poplar Assay Data.zip
poster_seiser_48x26_2003.pdf
Single Particle Reactor: Filling Gaps in Experimental Space and Enabling Model Parameterization
Description
The single particle reactor enables the study of the thermochemical conversion (pyrolysis or gasification) on a single particle with mass up to 2 g, temperatures up to 830°C, heating rates of 50°C/s, and mass loss resolution of 1 mg with analysis of evolved vapors.
Value of new tool
This tool will allow for experimental validation of single particle pyrolysis model which will inform industry on effects of particle size, shape, and particle size-distributions on the reaction kinetics. It allows an increase in throughput of roughly 10x from current systems (furnace remains heated between samples), enabling the iterative collaboration between modelers and experimentalists with sufficient data generation.
Industry Impact
Feedstock providers and industry partners benefit from improved modeling of changes in material attributes and operating conditions. This will lead to increased confidence and decreased timelines during scaling up of industrial biomass conversion processes. The tool also provides a unique visual component, allowing direct observation of particle cracking, pellet explosion, and change in radius with temperature.
SPR Images
NRG 2017 Paper Study Overview
Investigator: Daniel P. Dupuis, R. Gary Grim, Eric Nelson, Eric C.D. Tan, Daniel A. Ruddy, Sergio Hernandez, Tyler Westover, Jesse E. Hensley, Daniel Carpenter
Link to study data
Citation
Daniel P. Dupuis, R. Gary Grim, Eric Nelson, Eric C.D. Tan,
Daniel A. Ruddy, Sergio Hernandez, Tyler Westover, Jesse E. Hensley, Daniel Carpenter,
High-Octane Gasoline from Biomass: Experimental, Economic, and Environmental Assessment,
Applied Energy,
Volume 241,
2019,
Pages 25-33,
ISSN 0306-2619,
https://doi.org/10.1016/j.apenergy.2019.02.064.
(https://www.sciencedirect.com/science/article/pii/S0306261919303617)
Article Included (See Attachment)
Link to publication: High Octane Gasoline from Biomass
I. Abstract
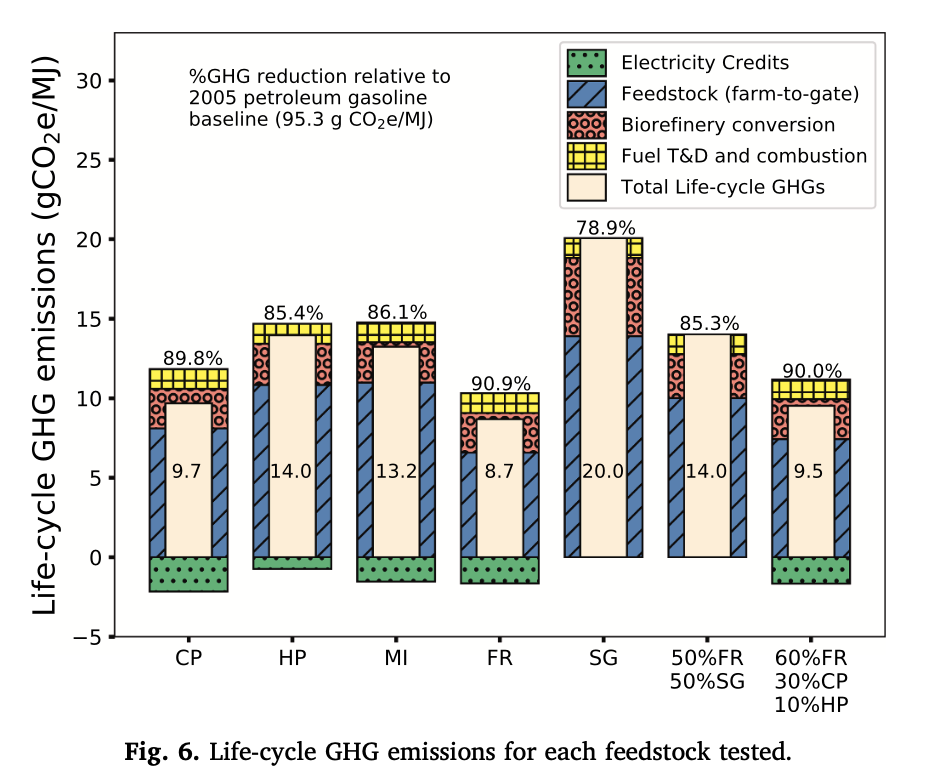
Five economically-advantaged biomass feedstocks identified in the United States Department of Energy’s 2016 Billion Ton Study were gasified and the syngas was reformed at the bench scale to study the feedstock price-performance relationship. The distribution of reformed syngas compositions, heating values, and yields were similar across the different feedstocks and blends thereof, which ranged from inexpensive residual wastes to more expensive and higher quality biomass, revealing that feedstock performance was mostly insensitive to its price. Custom blended feedstocks produced syngas with characteristics resembling linear combinations of syngas from single-component feedstocks, supporting the ability to customize and predict blended properties based on single-feedstock data. The experimental gasification data informed a techno-economic analysis of specific feedstock costs for producing high-octane gasoline, and the results showed that miscanthus and forest residues were the most cost-effective. A field-to-wheels life-cycle assessment of greenhouse gas emissions showed that forest residues was the most environmentally benign feedstock of those studied.
II. Method Visualization
Figure 1: Schematic of fluidized bed gasification system with downstream hydrocarbon reformer and acid-gas scrubber highlighting three analytical locations.
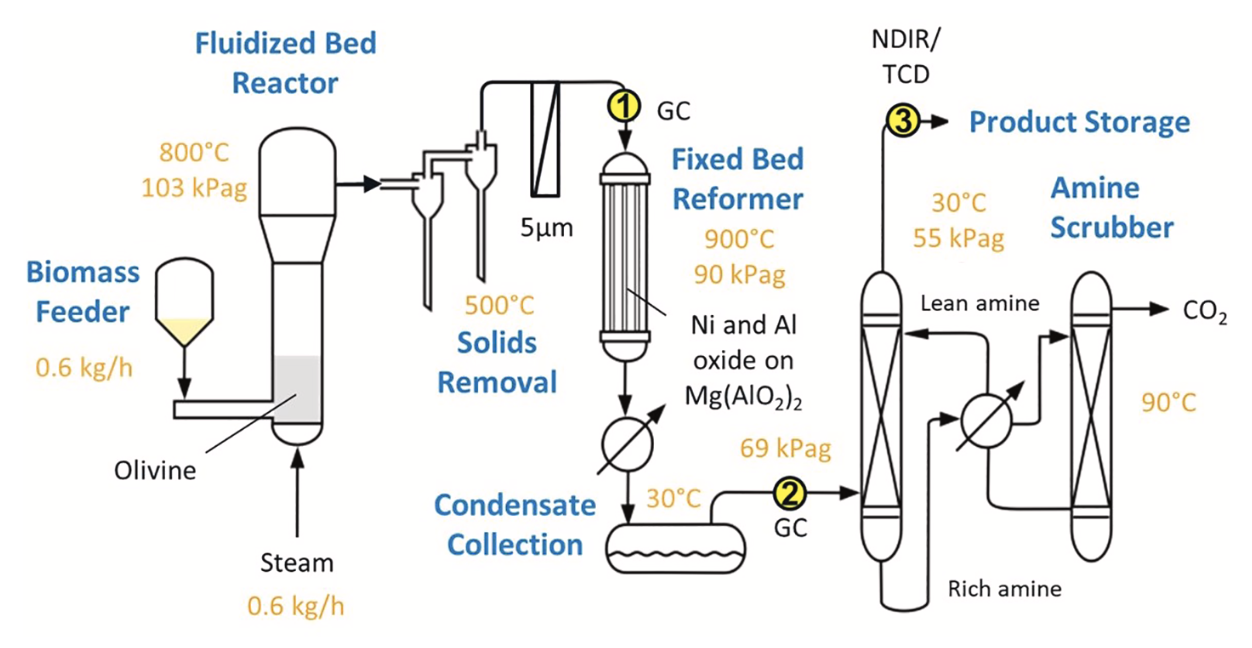
Figure 2: Simplified block flow diagram of the biomass-to-HOG blendstock conversion process. Adapted from Tan et al
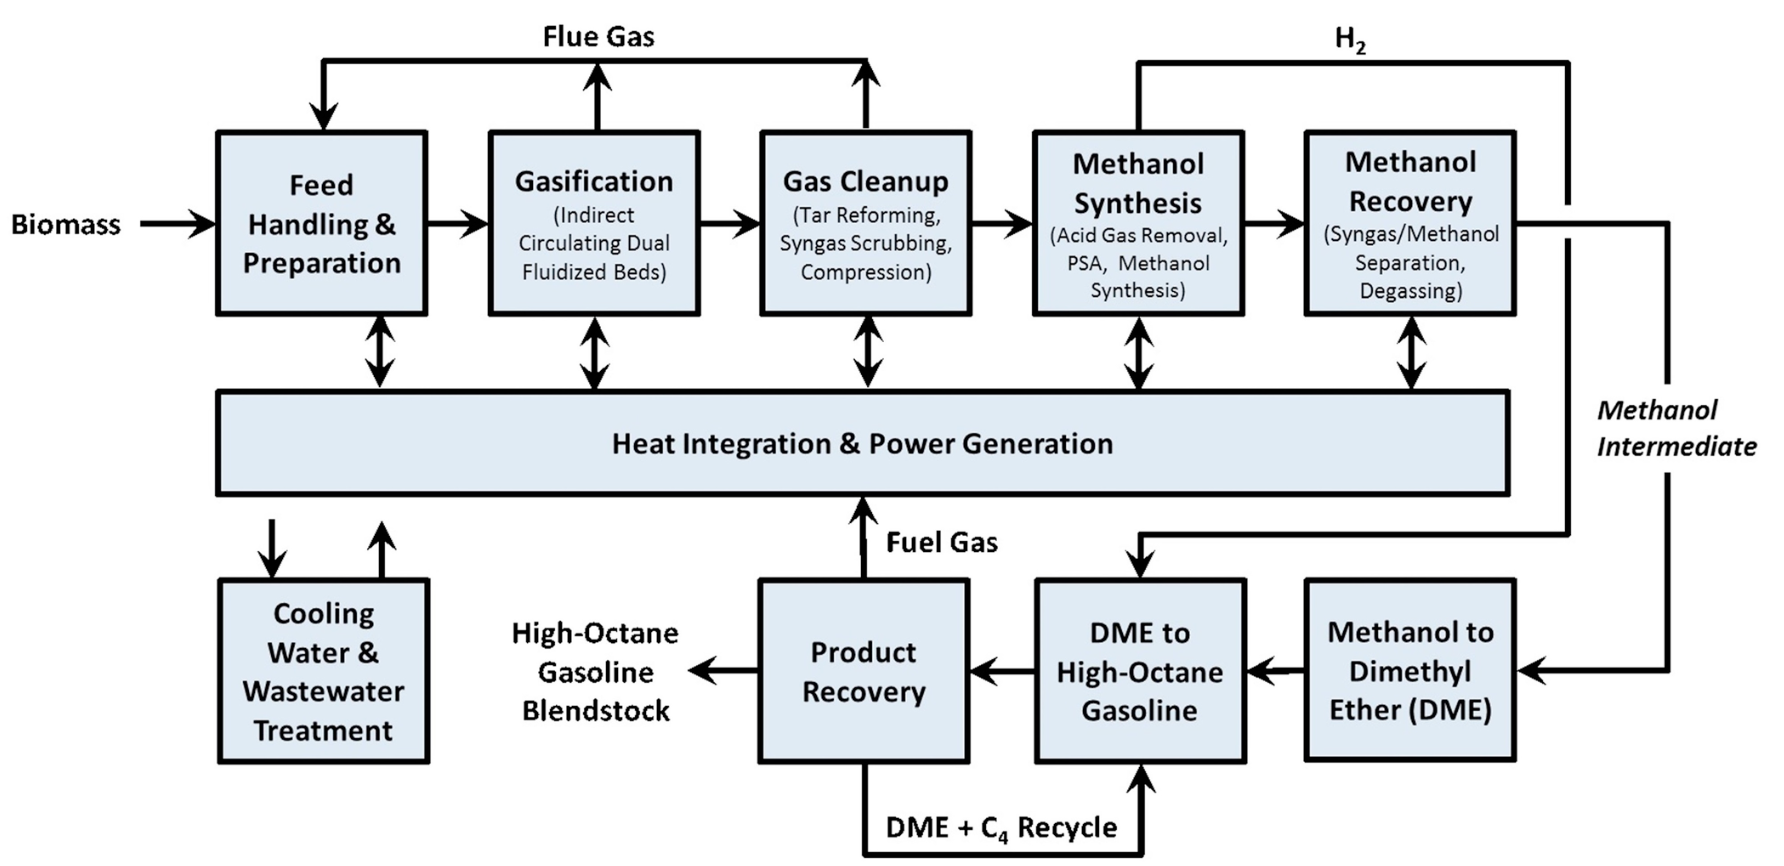
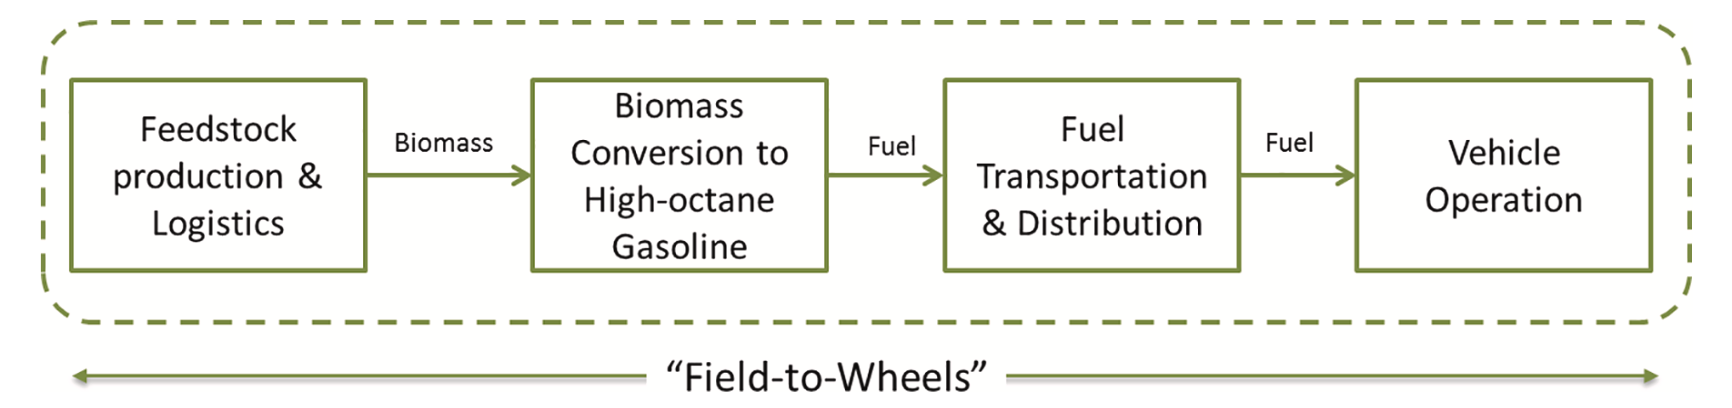
Figure 3: Life-cycle system boundary for LCA evaluation.
III. Gasification – Figure 1
A schematic of the gasification system used in these experiments is shown in Figure 1. A dual-screw K-Tron hopper metered biomass at 0.6 kg h−1 to a 15.9 mm (OD) feed screw that continuously conveyed it into a 10.16 cm (ID) fluidized bed reactor maintained at 800 °C and 103 kPa. Steam was introduced through the bottom of the reactor at 0.6 kg h−1 to fluidize the olivine bed material, yielding a 1:1 (wt/wt) steam to biomass ratio. A series of two downstream cyclones and a hot gas filter at 500 °C and 98 kPa removed solids from the syngas stream before reforming. The fixed bed reformer, held at 900 °C and 90 kPa contained 7.86 kg of a commercial nickel reforming catalyst (Haldor-Topsoe R-67-7H) which upgraded the raw product gas, contributing to an increase in syngas yield, removal of hydrocarbons (Eq. (1)), and a shift in the relative H2 and CO concentrations (Eq. (2)).
Steam hydrocarbon reforming: CnH2n+2 + nH2O nCO + (2n + 1)H2 (1)
Water gas shift: CO + H2O CO2 + H2 (2)
After reforming, the syngas was cooled to approximately 30 °C and 69 kPa to condense water and any residual heavy hydrocarbons before finally passing through an acid-gas scrubber at 90°C and 55kPa to remove CO2 and H2S. The scrubbing fluid contained 30wt% mono- ethanolamine (MEA), 10 wt% methyl-diethanolamine (MDEA), and 60 wt% water. The syngas composition was measured at three points within the system as depicted in Fig. 1. An Agilent 7890A gas chro- matograph (GC) calibrated for permanent gases and hydrocarbon compounds up to C4 analyzed a slip-stream of raw and reformed syngas at locations one and two, respectively. A California Analytical Instru- ments nondispersive infrared analyzer (NDIR) and Nova Analytical Systems thermal conductivity detector (TCD) continuously monitored.
CO, CO2, O2, CH4, and H2 concentrations at the outlet of the acid-gas scrubber, location 3. The NDIR and TCD data was used to confirm steady-state operation, at which point data collection commenced. In total, gases were sampled over a minimum of three consecutive gas injections per stream at a rate of one sample every 20 min for a total of six datasets (three pre-reformer, three post-reformer).
IV. Techno-economic analysis – Figure 2
A simplified process flow diagram for the biomass-to-HOG conver- sion pathway used as the exemplary TEA case is shown in Figure 2. The detailed process description can be found in Tan et al. [16]. The diagram depicts the major processing steps for the conversion of biomass to syngas via indirect steam gasification, syngas cleanup, and sequential synthesis of methanol, dimethyl ether (DME), and high-octane hydro- carbons.The primary economic indicator for this analysis is specific feed- stock cost, which is defined as the cost of HOG production attributed to the feedstock cost, in dollars per gallon of gasoline equivalent ($/GGE), as illustrated in Equation (3). GGE is based on the lower heating value (LHV) of gasoline (32,356 kJ/L) obtained from Argonne National La- boratory’s GREET model software [17]; the LHV for HOG in this work is 31,094 kJ/L. All costs are adjusted to 2014 US dollars. The HOG yields as a function of feedstock compositions were determined from the Aspen Plus process model simulation [16].
Specific Feedstock Cost = Feedstock Cost /HOG Yield (3)
The assumed design capacity was 2000 dry tonnes per day (2205 dry US tons per day). With an expected 7884 operating hours per year (90% on-stream factor/availability), the annual feedstock requirement is approximately 657,000 dry tonnes per year (724,000 dry US tons per year). The assumed onstream factor allows approximately 36 days of planned and unplanned downtime per year.
The TEA reported here uses nth-plant economic assumptions, the key aspect of which is that a successful industry has been established with many operating plants using similar process technologies. The TEA model encompasses a process model and an economic model. For a given set of conversion parameters, the process model solves mass and energy balances for each unit operation. This data is used to size and cost process equipment and compute raw material and other operating costs. The capital and operating costs are then used for a discounted cash flow rate of return analysis [16]. The nth-plant economic assumptions are summarized in Table 1, while the capital costs and annual operating costs are presented in Tables 2 and 3, respectively.
V. Life-cycle assessment – Figure 3
A complete life-cycle assessment (LCA) study typically evaluates multiple impact categories, including global warming potential, acid- ification, eutrophication, resource depletion, and water use. While LCA can certainly be employed to evaluate a wide range of sustainability indicators, this study focuses only on the life-cycle GHG emissions. The scope of this attributional LCA study concentrated on the field-to-wheels (FTW) GHG emissions of the high-octane gasoline blendstock. GHG emissions are represented in grams of carbon dioxide equivalent (CO2e) using a 100-year GHG emission factor [18]. The system boundary for the LCA study is depicted in Figure 3. For this analysis, we account for the stages in the life cycle of the HOG fuel, including feedstock production and logistics, fuel production and transportation, and fuel consumption or vehicle operation. The functional unit is one megajoule (MJ) of fuel consumed. Additionally, the current LCA was performed to evaluate the entire supply chain or life-cycle GHG emissions of the high-octane gasoline product and is not intended to assess only on any particular unit operation (e.g., gasification).
The corresponding reference flows and life-cycle inventories are summarized in Table 4, which are based on material and energy inputs and outputs to the biorefinery estimated from the simulated conversion processes. The material and energy flows in the conversion step capture the impacts of input raw materials, and outputs, such as emissions, wastes, and coproducts as predicted by the process model. The copro- ducts (excess electricity) are treated as avoided products using the product displacement method [19]. Coproduct displacement is also known as system boundary expansion and is based on the concept of displacing the existing product with the new product. [17]. The GHG basis values for biomass feedstock production and logistics, fuel trans- portation and end use, and electricity are largely applied consistently with the values utilized in GREET [17]. Table 5 summarizes the GHG emission factors employed for the LCA evaluation. The GHG emission factors are used to convert the life-cycle inventory to the life-cycle GHG emissions to a common unit (g CO2e/MJ). It is assumed that carbon sequestered during biomass growth ends up in the fuel after the pro- duction step and returns to the atmosphere in the exhaust stream after the fuel combusts in the engine, so that biogenic carbon is treated as credit.
VI. Results
1. Feedstock properties
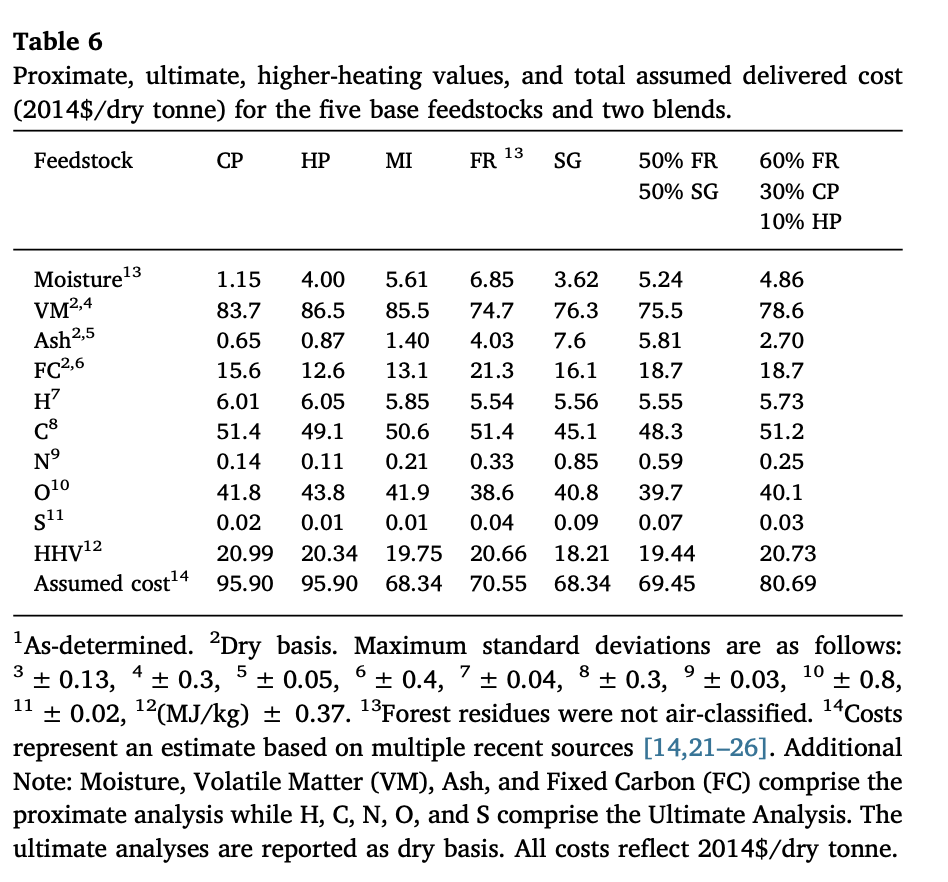
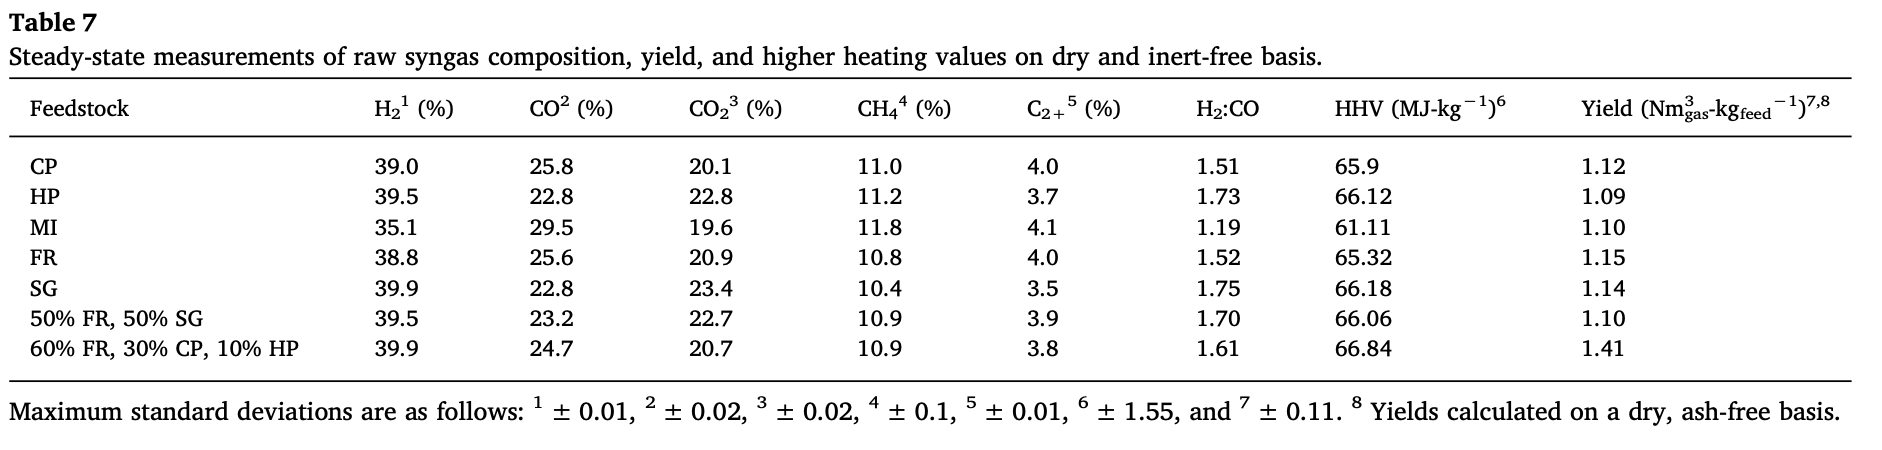
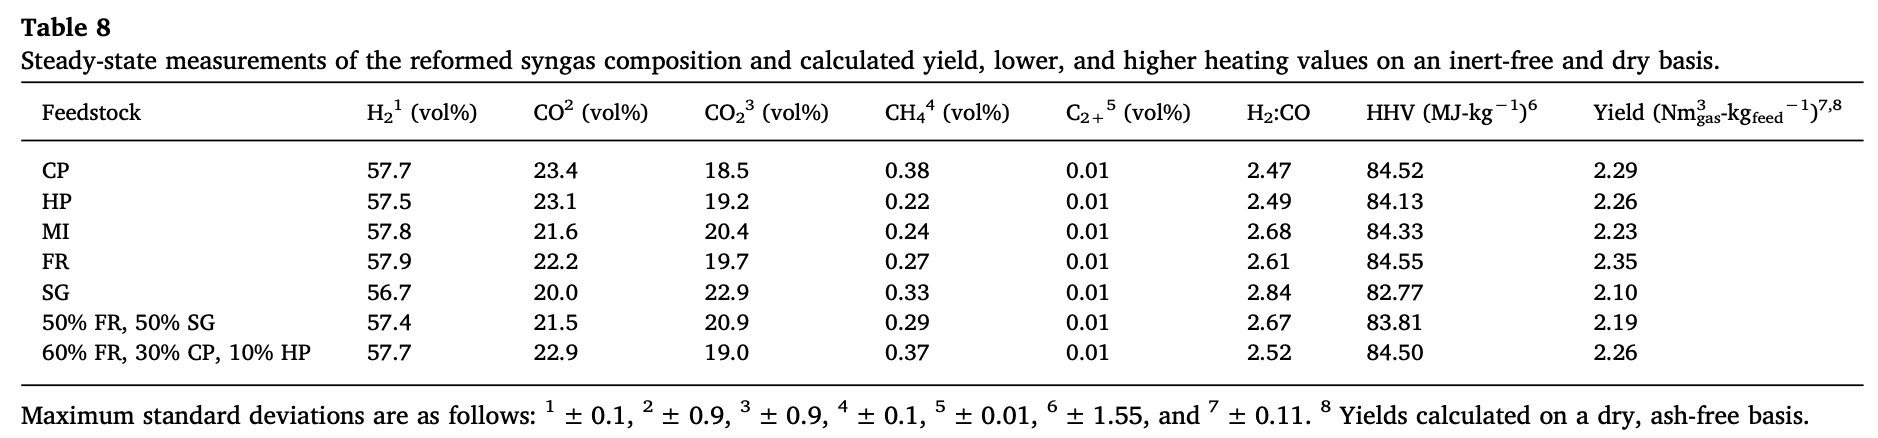
2. Syngas composition
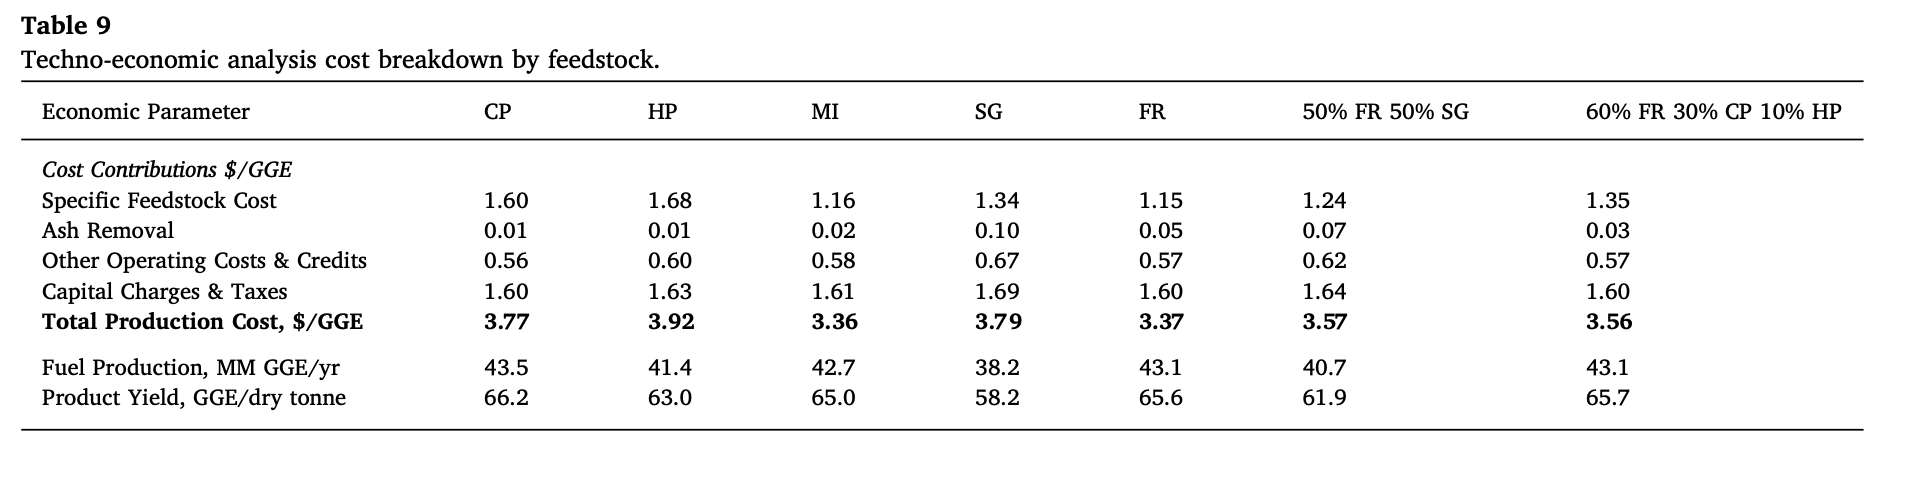
3. Techno-economic analysis and life-cycle assessment
VIII. Contact Us
If you have any questions, concerns, please don't hesitate to reach out via email at: Anne.Starace.nrel@gov
Executive Summary
The goal of this page is to effectively communicate the data sets from NREL's two inch fluidized bed reactor run for the FCIC in FY23. See data in "File Count" entries on right with description "T.06-DS-HT-C-2 NREL 2FBR Pyrolysis Data FY21" for relevant datasets.
| NREL: Anne Starace, Reinhard Seiser; Peter Ciesielski; LANL: Ben Davis, Ricardo Navar; PNNL: Huamin Wang, Jennifer Jocz, Miki Santosa; NETL: Subhodeep Banerjee, Yupeng Xu, Mehrdad Shahnam; ORNL: Jim Parks, Femi Oyedeji; INL: Jordan Klinger. | True |
12
|
38
|
0
|
4
| False |